context
Command context

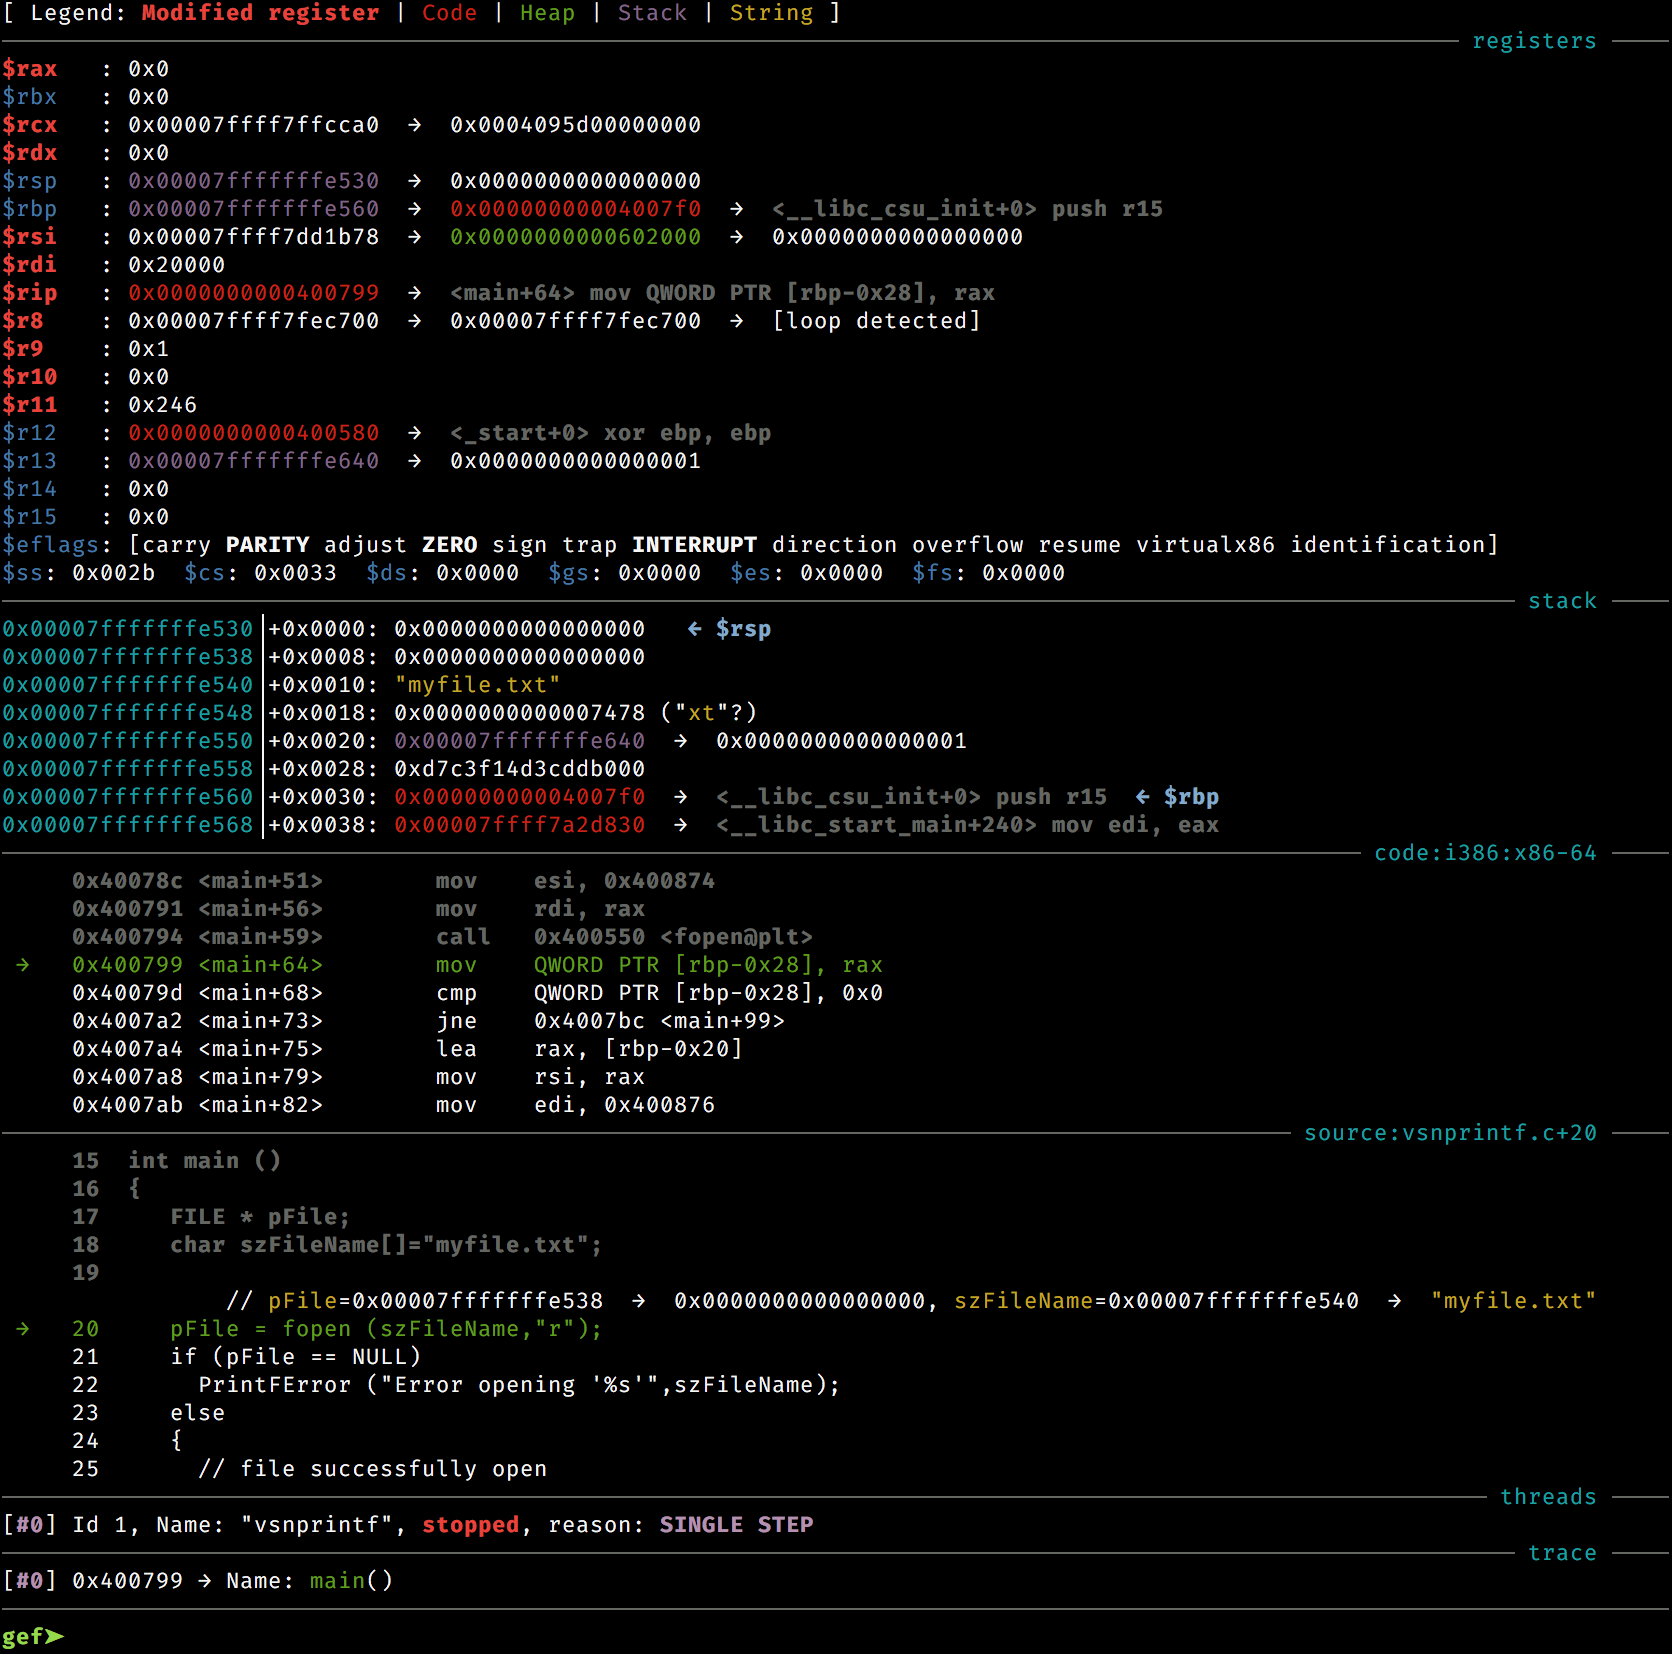
gef (not unlike PEDA or fG! famous gdbinit) provides comprehensive context menu when hitting a
breakpoint.
- The register context box displays current register values. Values in red indicate that this
register has had its value changed since the last time execution stopped. It makes it convenient
to track values. Register values can be also accessed and/or dereferenced through the
regcommand. - The stack context box shows the 10 (by default but can be tweaked) entries in memory pointed by the stack pointer register. If those values are pointers, they are successively dereferenced.
- The code context box shows the 10 (by default but can be tweaked) next instructions to be executed.
Adding custom context panes
As well as using the built-in context panes, you can add your own custom pane that will be displayed
at each break-like event with all the other panes. Custom panes can be added using the API:
register_external_context_pane(pane_name, display_pane_function, pane_title_function)
Check the API documentation to see a full usage of the registration API.
Editing context layout
gef allows you to configure your own setup for the display, by re-arranging the order with which
contexts will be displayed.
gef➤ gef config context.layout
There are currently 6 sections that can be displayed:
legend: a text explanation of the color coderegs: the state of registersstack: the content of memory pointed by$spregistercode: the code being executedargs: if stopping at a function calls, print the call argumentssource: if compiled with source, this will show the corresponding line of source codethreads: all the threadstrace: the execution call traceextra: if an automatic behavior is detected (vulnerable format string, heap vulnerability, etc.) it will be displayed in this panememory: peek into arbitrary memory locations
To hide a section, simply use the context.layout setting, and prepend the section name with - or
just omit it.
gef➤ gef config context.layout "-legend regs stack code args -source -threads -trace extra memory"
This configuration will not display the legend, source, threads, and trace sections.
The memory pane will display the content of all locations specified by the
memory command. For instance,
gef➤ memory watch $sp 0x40 byte
will print a hexdump version of 0x40 bytes of the stack. This command makes it convenient for
tracking the evolution of arbitrary locations in memory. Tracked locations can be removed one by one
using memory unwatch, or altogether with memory reset.
The size of most sections are also customizable:
nb_lines_stackconfigures how many lines of the stack to show.nb_lines_backtrackconfigures how many lines of the backtrace to show.nb_lines_codeandnb_lines_code_prevconfigure how many lines to show after and before the PC, respectively.context.nb_lines_threadsdetermines the number of lines to display inside the thread pane. This is convenient when debugging heavily multi-threaded applications (apache2, firefox, etc.). It receives an integer as value: if this value is-1then all threads state will be displayed. Otherwise, if the value is set toN, then at mostNthread states will be shown.
To have the stack displayed with the largest stack addresses on top (i.e., grow the stack downward), enable the following setting:
gef➤ gef config context.grow_stack_down True
If the saved instruction pointer is not within the portion of the stack being displayed, then a section is created that includes the saved ip and depending on the architecture the frame pointer.
0x00007fffffffc9e8│+0x00: 0x00007ffff7a2d830  →  <__main+240> mov edi, eax    ($current_frame_savedip)
0x00007fffffffc9e0│+0x00: 0x00000000004008c0  →  <__init+0> push r15    ← $rbp
. . . (440 bytes skipped)
0x00007fffffffc7e8│+0x38: 0x0000000000000000
0x00007fffffffc7e0│+0x30: 0x0000000000000026 ("&"?)
0x00007fffffffc7d8│+0x28: 0x0000000001958ac0
0x00007fffffffc7d0│+0x20: 0x00007ffff7ffa2b0  →  0x5f6f7364765f5f00
0x00007fffffffc7c8│+0x18: 0x00007fff00000000
0x00007fffffffc7c0│+0x10: 0x00007fffffffc950  →  0x0000000000000000
0x00007fffffffc7b8│+0x08: 0x0000000000000000
0x00007fffffffc7b0│+0x00: 0x00007fffffffc7e4  →  0x0000000000000000      ← $rsp
Redirecting context output to another tty/file
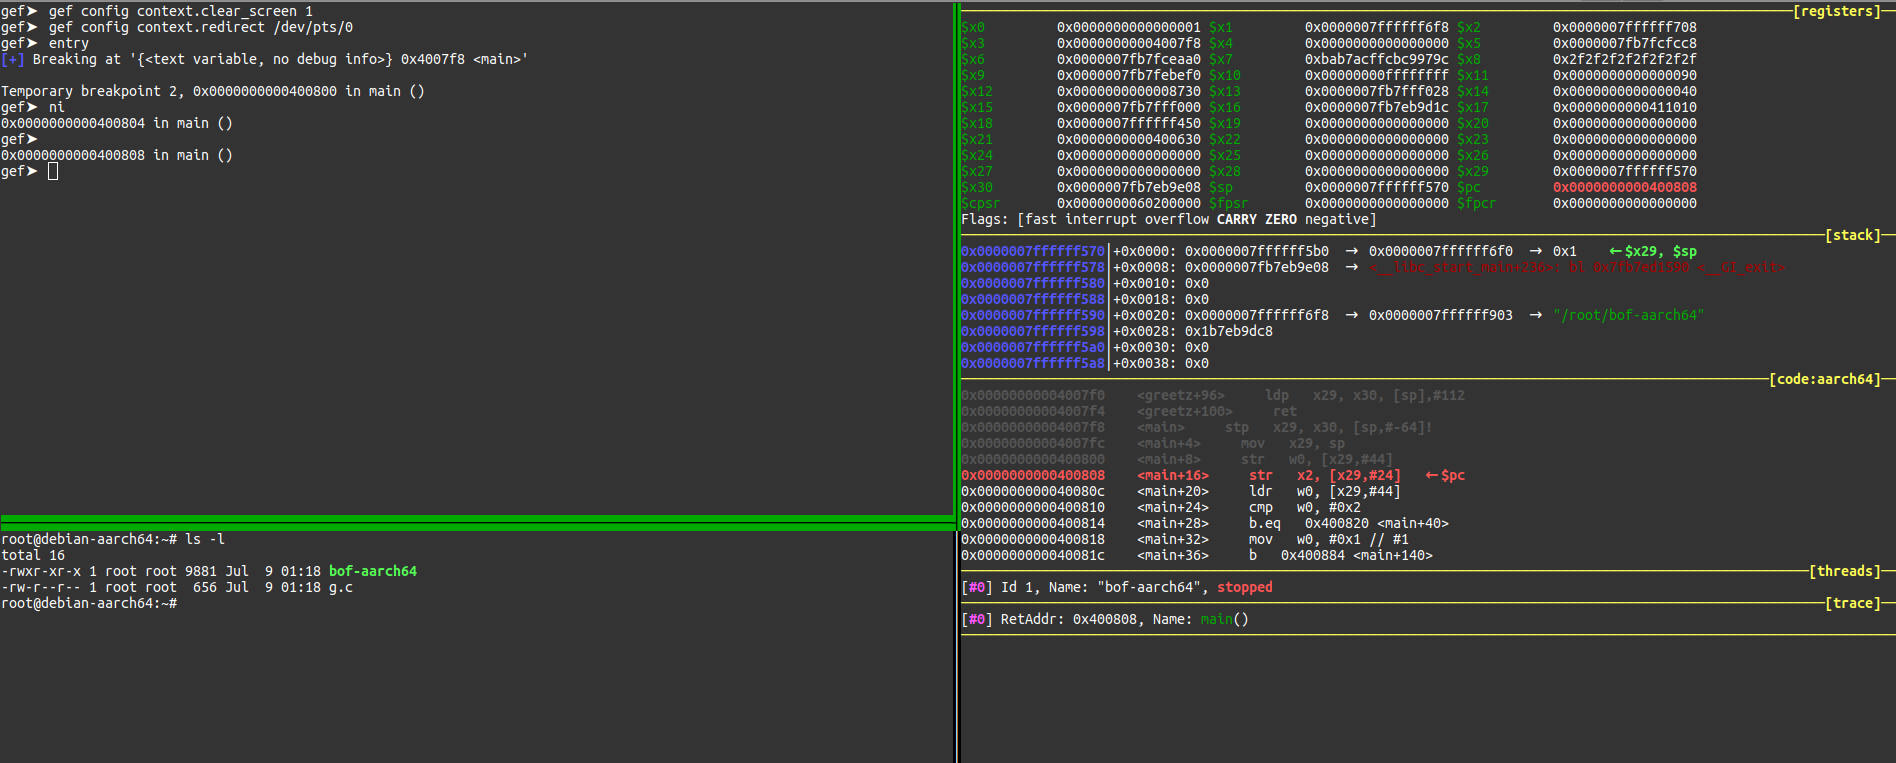
By default, the gef context will be displayed on the current TTY. This can be overridden by
setting context.redirect variable to have the context sent to another section.
To do so, select the TTY/file/socket/etc. you want the context redirected to with gef config.
Enter the command tty in the prompt:
$ tty
/dev/pts/0
Then tell gef about it!
gef➤ gef config context.redirect /dev/pts/0
Enjoy:

To go back to normal, remove the value:
gef➤ gef config context.redirect ""
Display individual sections
You can display a single section by specifying it as an argument:
gef➤ context regs
Multiple sections can be provided, even if they are not part of the current layout:
gef➤ context regs stack
Examples
- Display the code section first, then register, and stack, hiding everything else:
gef➤ gef config context.layout "code regs stack"
- Stop showing the context sections when breaking:
gef➤ gef config context.enable 0
- Clear the screen before showing the context sections when breaking:
gef➤ gef config context.clear_screen 1
- Don't dereference the registers in the
regssection (more compact):
gef➤ gef config context.show_registers_raw 1
- Number of bytes of opcodes to display next to the disassembly.
gef➤ gef config context.show_opcodes_size 4
- Don't 'peek' into the start of functions that are called.
gef➤ gef config context.peek_calls False
- Hide specific registers from the registers view.
gef➤ gef config context.ignore_registers "$cs $ds $gs"
- Hide the extra pc context info from the source code view.
gef➤ gef config context.show_source_code_variable_values 0
- Control how source file path is displayed.
When displaying the source file name, above the source code view, the following settings can be changed:
gef➤  gef config context.show_full_source_file_name_max_len 30
gef➤  gef config context.show_prefix_source_path_name_len 10
gef➤  gef config context.show_basename_source_file_name_max_len 20
In this example, if the file path length is less than or equal to 30 it will be displayed in its entirety. If however, it's more than 30 characters in length, it will be truncated.
Truncation first splits the path into the prefix part and file name part. The
show_prefix_source_path_name_len controls how many characters of the prefix
path to show, and the show_basename_source_file_name_max_len controls how
many characters from the file name to show.
- Show better definitions for call to libc functions.
gef➤  gef config context.libc_args True
gef➤  gef config context.libc_args_path /path/to/gef-extras/libc_args