memory
Command memory
As long as the 'memory' section is enabled in your context layout (which it is by default), you can register addresses, lengths, and grouping size.
Note: this command should NOT be mistaken with the GDB watch
command meant to set
breakpoints on memory access (read,write,exec).
Adding a watch
Specify a location to watch and display with the context, along with their optional size and format:
Syntax:
memory watch <ADDRESS> [SIZE] [(qword|dword|word|byte|pointers)]
If the format specified is pointers, then the output will be similar to executing the command
dereference $address. For all other format, the output will be an hexdump of the designated
location.
Note that the address format is a GDB therefore a symbol can be passed to it. It also supports
allowing to easily track commonly used addresses:
For example, to watch the first 5 entries of the GOT as pointers:
gef ➤ memory watch $_got()+0x18 5
[+] Adding memwatch to 0x555555773c50
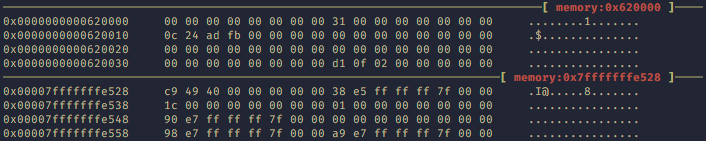
Which, when the context is displayed, will show something like:

Removing a watch
Remove a watched address. To list all the addresses being watched, use memory list.
Syntax:
memory unwatch <ADDRESS>
Listing watches
Enumerate all the addresses currently watched by the memory command.
Syntax:
memory list
The command will output a list of all the addresses watched, along with the size and format to display them as.
Resetting watches
Empties the list of addresses to watch.
Syntax:
memory reset